
Test data
icOn 5 Measurements
Real bench data, not marketing claims. Distortion, noise floor and tilt control frequency response — measured and published so you can judge the engineering for yourself.
01 — Distortion & noise
Distortion and FFT spectra.
Measured at 1 kHz, −20.72 dBFS, 0–22.8 kHz span. The result is a remarkably clean spectrum with no significant harmonic content — exactly what you’d expect from a passive signal path with no active gain stage to introduce distortion.
The THD figure of 0.000069% (H2–H10) is exceptional for any preamplifier, active or passive. Even including noise, THD+N measures just 0.0085%.
0.000069%
THD (H2–H10)
0.0085%
THD+N
81.4 dB
SNR
17.2 bits
ENOB
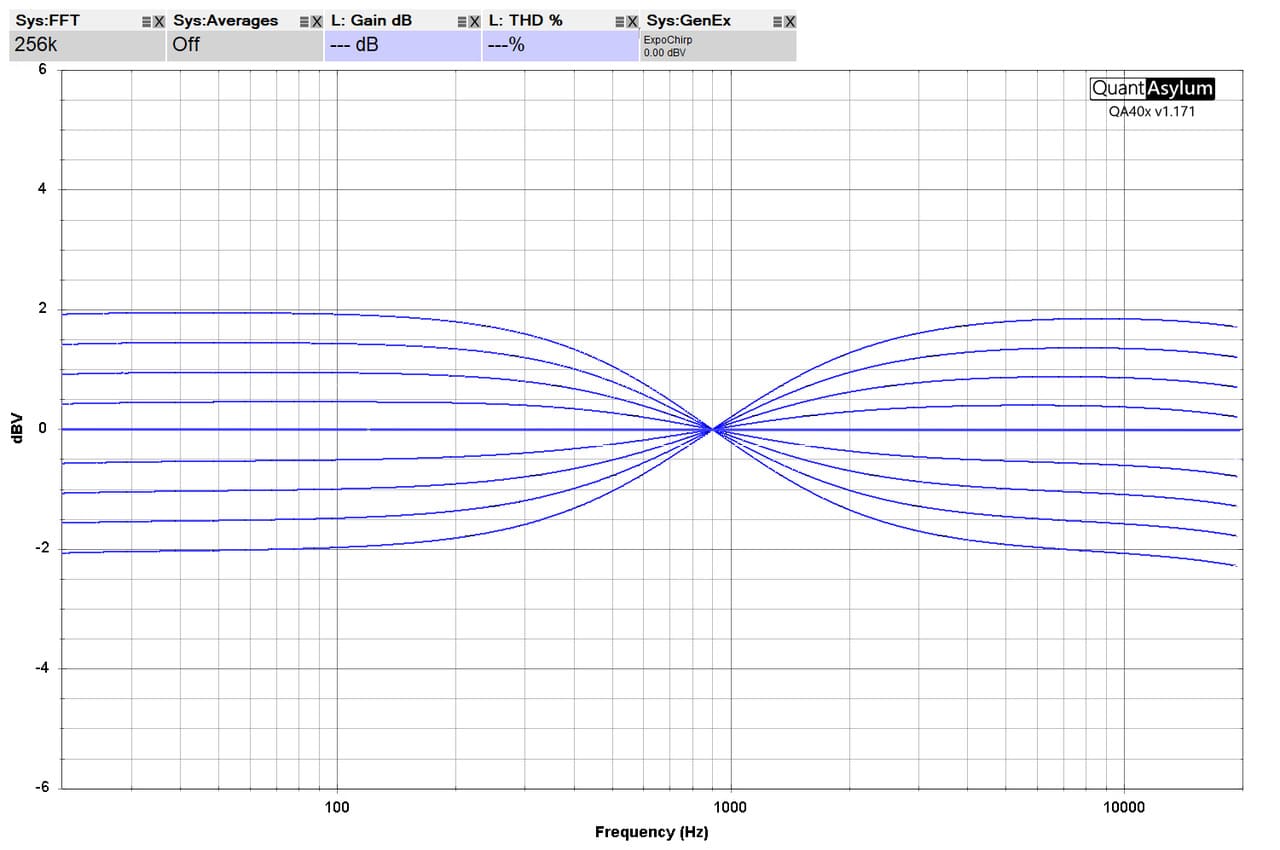
02 — Tilt control
Frequency response of the tilt control.
The 8-step tilt control produces a smooth, symmetrical fan of curves pivoting at approximately 900 Hz — exactly where the control is centred. There is no sudden change at any point across the audio band, which is precisely the design intent.
At the extremes, each setting provides up to ±2 dB of gentle boost or cut at 20 Hz and 20 kHz, in roughly 0.5 dB steps. The result is a tonal adjustment you can feel but never hear as “colouration.”
Measured on a QuantAsylum QA40x audio analyser, 256k FFT.
±2 dB
Max boost/cut at 20 Hz / 20 kHz
8 steps
0.5 dB per step
~900 Hz
Pivot frequency
Want to know more?
Numbers tell part of the story. Reviewers tell the rest.
Read what independent audio publications heard when they put the icOn 5 through its paces.
Stay in the loop
Sign up to the newsletter
News, new models and special offers from Paul Grand Audio.